
CURRENT ACTIVE TORNADO AND SEVERE THUNDERSTORM WARNINGS AND WATCHES ARE SHOWN ON THE FOLLOWING SIX MAPS AND FOLLOWING EACH MAP ARE LINKS THAT WILL TAKE YOU TO THE DETAILS FOR ANY WARNING OR WATCH
ON THE SEVERE ALERT MAPS >>>
--COUNTIES COLORED IN RED HAVE A CURRENT, ACTIVE TORNADO WARNING IN EFFECT.
--Counties colored in yellow have a SEVERE THUNDERSTORM WARNING in effect.
--Tornado Watch areas are outlined in red.
--Severe Thunderstorm Watch areas are outlined in yellow.
--See the color code keys on any of the six maps for other warnings and advisories that might be in effect.
Under each severe alerts map are links that will take you straight to the details about any warning or watch. These links are organized by state. In these three steps you get to the particular warning.
INSTRUCTIONS FOR GETTING TO WARNING AND WATCH DETAILS
(1) Find the map that is for your state (out of the six maps). Use the list of states below each map rather than the map itself to do this.
(2) Under the map there are links under each state to all National Weather Service (NWS) offices that cover one or more counties in that state. Click the applicable link. To verify you have the correct one, make sure the county you are checking shows up on the interactive forecast map at the NWS office Site you have arrived at.
(3) Either click your spot on the NWS forecast map OR you can click "Tornado Warnings" that is to the right of the interactive forecast map. However, when there are a lot of warnings it is better to click on the map itself.
OR WHEN THERE IS NO TORNADO OUTBREAK AND ONLY A FEW WARNINGS AT ONCE you can see all current tornado warnings in effect anywhere by clicking the link just below. BUT DURING A MAJOR TORNADO OUTBREAK THE LINK IMMEDIATELY FOLLOWING WILL BE NEAR USELESS because during an outbreak there will be so many warnings that it will be near impossible to find the particular warnings that apply to you! Therefore, during a tornado outbreak when there are numerous warnings at once follow the three steps above.
For details on ALL current tornado warnings in effect ANYWHERE in the US CLICK HERE
For details on ALL current severe thunderstorm warnings n effect ANYWHERE in the US CLICK HERE
SOUTH CENTRAL AREA SEVERE WEATHER ALERTS

For details about any warning or watch click the most appropriate link below
THE ABOVE MAP IS SEVERE ALERTS MAP ONE OF SIX
SOUTH CENTRAL AREA SEVERE WEATHER ALERTS
This map shows current severe weather alerts including tornado warnings and severe thunderstorm warnings for
--NEW MEXICO
--OKLAHOMA
--ARKANSAS
--TEXAS
--LOUISIANA
Below are links that take you to the details for all severe weather alerts including tornado warnings and severe thunderstorm warnings for the above states. For other states including ones shown on the map but not listed above proceed to another map to find the links to the current tornado and severe thunderstorm warnings. (There are six severe weather alert maps and to minimize confusion each state is assigned to just one map by Big Tornado Country. Each state is assigned to the map that is the most appropriate from a tornado and severe storm tracking perspective.)
ALL National Weather Service Offices that cover any part of a state (even just one county) are linked to under each state. All counties are covered by at least one office; for a very small number of counties the most applicable office is in the state next door. Click on the most applicable one.
LINKS TO DETAILS FOR TORNADO WARNINGS, SEVERE THUNDERSTORM WARNINGS AND ALL OTHER SEVERE WEATHER ALERTS
NEW MEXICO WARNING AND WATCH DETAILS
--Albuquerque Region
--El Paso Region
--Midland-Odessa Region
OKLAHOMA WARNING AND WATCH DETAILS
--Amarillo Region
--Norman-Oklahoma City Region
--Tulsa Region
--Shreveport Region
ARKANSAS WARNING AND WATCH DETAILS
--Tulsa Region
--Little Rock Region
--Memphis Region
--Shreveport Region
--Jackson Region
TEXAS WARNING AND WATCH DETAILS
--Amarillo Region
--Lubbock Region
--Oklahoma City-Norman Region
--El Paso Region
--Midland-Odessa Region
--San Angelo Region
--Dallas-Fort Worth Region
--Shreveport Region
--San Antonio Region
--Houston Region
--Lake Charles Region
--Corpus Christi Region
--Brownsville Region
LOUISIANA WARNING AND WATCH DETAILS
--Shreveport Region
--Jackson Region
--Lake Charles Region
--New Orleans Region
CENTRAL AREA SEVERE WEATHER ALERTS

For details about any warning or watch click the most appropriate link below.
THE ABOVE MAP IS SEVERE ALERTS MAP TWO OF SIX
CENTRAL AREA SEVERE WEATHER ALERTS
This map shows current severe weather alerts including tornado warnings and severe thunderstorm warnings for
--NEBRASKA
--IOWA
--ILLINOIS
--COLORADO
--KANSAS
--MISSOURI
Below are links that take you to the details for all severe weather alerts including tornado warnings and severe thunderstorm warnings for the above states. For other states including ones shown on the map but not listed above proceed to another map to find the links to the current tornado and severe thunderstorm warnings. (There are six severe weather alert maps and to minimize confusion each state is assigned to just one map by Big Tornado Country. Each state is assigned to the map that is the most appropriate from a tornado and severe storm tracking perspective.)
ALL National Weather Service Offices that cover any part of a state (even just one county) are linked to under each state. All counties are covered by at least one office; for a very small number of counties the most applicable office is in the state next door. Click on the most applicable one.
LINKS TO DETAILS FOR TORNADO WARNINGS, SEVERE THUNDERSTORM WARNINGS AND ALL OTHER SEVERE WEATHER ALERTS
NEBRASKA WARNING AND WATCH DETAILS
--Cheyenne Region
--North Platte Region
--Goodland Region
--Hastings Region
--Omaha Region
--Sioux Falls Region
IOWA WARNING AND WATCH DETAILS
--Sioux Falls Region
--Omaha Region
--Des Moines Region
--La Crosse Region
--Quad Cities Region
ILLINOIS WARNING AND WATCH DETAILS
--Quad Cities Region
--Chicago Region
--Lincoln-Peoria-Springfield Region
--St. Louis Region
--Paducah Region
COLORADO WARNING AND WATCH DETAILS
--Goodland Region
--Denver-Boulder Region
--Pueblo Region
--Grand Junction Region
KANSAS WARNING AND WATCH DETAILS
--Goodland Region
--Hastings Region
--Dodge City Region
--Wichita Region
--Topeka Region
MISSOURI WARNING AND WATCH DETAILS
--Kansas City Region
--Springfield Region
--Quad Cities Region
--St. Louis Region
--Paducah Region
--Memphis Region
NORTH CENTRAL AREA SEVERE WEATHER ALERTS

For details about any warning or watch click the most appropriate link below.
THE ABOVE MAP IS SEVERE ALERTS MAP THREE OF SIX
NORTH CENTRAL AREA SEVERE WEATHER ALERTS
This map shows current severe weather alerts including tornado warnings and severe thunderstorm warnings for
--MONTANA
--NORTH DAKOTA
--WYOMING
--SOUTH DAKOTA
--MINNESOTA
--WISCONSIN
--MICHIGAN
Note: Western Montana and Western Wyoming are not covered by Big Tornado Country due to the lack of tornadoes there.
Below are links that take you to the details for all severe weather alerts including tornado warnings and severe thunderstorm warnings for the above states. For other states including ones shown on the map but not listed above proceed to another map to find the links to the current tornado and severe thunderstorm warnings. (There are six severe weather alert maps and to minimize confusion each state is assigned to just one map by Big Tornado Country. Each state is assigned to the map that is the most appropriate from a tornado and severe storm tracking perspective.)
ALL National Weather Service Offices that cover any part of a state (even just one county) are linked to under each state. All counties are covered by at least one office; for a very small number of counties the most applicable office is in the state next door. Click on the most applicable one.
LINKS TO DETAILS FOR TORNADO WARNINGS, SEVERE THUNDERSTORM WARNINGS AND ALL OTHER SEVERE WEATHER ALERTS
MONTANA WARNING AND WATCH DETAILS
--Glasgow Region
--Billings Region
NORTH DAKOTA WARNING AND WATCH DETAILS
--Bismarck Region
--Grand Forks / Fargo Region
WYOMING WARNING AND WATCH DETAILS
--Rapid City Region
--Cheyenne Region
SOUTH DAKOTA WARNING AND WATCH DETAILS
--Rapid City Region
--Aberdeen Region
--Sioux Falls Region
MINNESOTA WARNING AND WATCH DETAILS
--Grand Forks / Fargo Region
--Duluth Region
--Minneapolis-St. Paul Region
--Sioux Falls Region
--La Crosse Region
WISCONSIN WARNING AND WATCH DETAILS
--Duluth Region
--Minneapolis-St. Paul Region
--Green Bay Region
--La Crosse Region
--Milwaukee Region
MICHIGAN WARNING AND WATCH DETAILS
--Marquette Region
--Traverse City / Alpena Region
--Grand Rapids Region
--Detroit Region
--South Bend / Fort Wayne Region
SOUTHEAST AREA SEVERE WEATHER ALERTS

For details about any warning or watch click the most appropriate link below.
THE ABOVE MAP IS SEVERE ALERTS MAP FOUR OF SIX
SOUTHEAST AREA SEVERE WEATHER ALERTS
This map shows current severe weather alerts including tornado warnings and severe thunderstorm warnings for
--TENNESSEE
--NORTH CAROLINA
--MISSISSIPPI
--ALABAMA
--GEORGIA
--SOUTH CAROLINA
--FLORIDA
Below are links that take you to the details for all severe weather alerts including tornado warnings and severe thunderstorm warnings for the above states. For other states including ones shown on the map but not listed above proceed to another map to find the links to the current tornado and severe thunderstorm warnings. (There are six severe weather alert maps and to minimize confusion each state is assigned to just one map by Big Tornado Country. Each state is assigned to the map that is the most appropriate from a tornado and severe storm tracking perspective.)
ALL National Weather Service Offices that cover any part of a state (even just one county) are linked to under each state. All counties are covered by at least one office; for a very small number of counties the most applicable office is in the state next door. Click on the most applicable one.
LINKS TO DETAILS FOR TORNADO WARNINGS, SEVERE THUNDERSTORM WARNINGS AND ALL OTHER SEVERE WEATHER ALERTS
TENNESSEE WARNING AND WATCH DETAILS
--Memphis Region
--Nashville Region
--Huntsville Region
--Knoxville-Morristown Region
NORTH CAROLINA WARNING AND WATCH DETAILS
--Blacksburg-Roanoke-Lynchburg Region
--Greenville-Spartanburg Region
--Knoxville-Morristown Region
--Raleigh Region
--Wilmington Region
MISSISSIPPI WARNING AND WATCH DETAILS
--Memphis Region
--Jackson Region
--New Orleans Region
--Mobile Region
ALABAMA WARNING AND WATCH DETAILS
--Huntsville Region
--Birmingham Region
--Mobile Region
--Tallahassee Region
GEORGIA WARNING AND WATCH DETAILS
--Atlanta Region
--Greenville-Spartanburg Region
--Columbia Region
--Charleston Region
--Tallahassee Region
--Jacksonville Region
SOUTH CAROLINA WARNING AND WATCH DETAILS
--Greenville-Spartanburg Region
--Columbia Region
--Wilmington Region
--Charleston Region
FLORIDA WARNING AND WATCH DETAILS
--Mobile Region
--Tallahassee Region
--Jacksonville Region
--Tampa Region
--Orlando-Melbourne Region
--Miami Region
--Key West Region
EASTERN AREA SEVERE WEATHER ALERTS

For details about any warning or watch click the most appropriate link below.
THE ABOVE MAP IS SEVERE ALERTS MAP FIVE OF SIX EASTERN AREA SEVERE WEATHER ALERTS
This map shows current severe weather alerts including tornado warnings and severe thunderstorm warnings for
--INDIANA
--OHIO
--PENNSYLVANIA
--NEW JERSEY
--KENTUCKY
--WEST VIRGINIA
--VIRGINIA
--MARYLAND
--DELAWARE
--TENNESSEE
--NORTH CAROLINA
Below are links that take you to the details for all severe weather alerts including tornado warnings and severe thunderstorm warnings for the above states. For other states including ones shown on the map but not listed above proceed to another map to find the links to the current tornado and severe thunderstorm warnings. (There are six severe weather alert maps and to minimize confusion each state is assigned to just one map by Big Tornado Country. Each state is assigned to the map that is the most appropriate from a tornado and severe storm tracking perspective.)
ALL National Weather Service Offices that cover any part of a state (even just one county) are linked to under each state. All counties are covered by at least one office; for a very small number of counties the most applicable office is in the state next door. Click on the most applicable one.
LINKS TO DETAILS FOR TORNADO WARNINGS, SEVERE THUNDERSTORM WARNINGS AND ALL OTHER SEVERE WEATHER ALERTS
INDIANA WARNING AND WATCH DETAILS
--Chicago Region
--South Bend--Fort Wayne Region
--Indianapolis Region
--Cincinnati-Columbus Region
--Paducah Region
--Louisville Region
OHIO WARNING AND WATCH DETAILS
--South Bend--Fort Wayne Region
--Cleveland Region
--Pittsburgh Region
--Cincinnati-Columbus Region
--Charleston Region
PENNSYLVANIA WARNING AND WATCH DETAILS
--Cleveland Region
--Pittsburgh Region
--State College Region
--Binghamton Region
--Philadelphia Region
NEW JERSEY WARNING AND WATCH DETAILS
--Philadelphia Region
KENTUCKY WARNING AND WATCH DETAILS
--Paducah Region
--Louisville Region
--Cincinnati Region
--Charleston Regon
--Morehead / Jackson / Hazard Region
--Knoxville-Morristown Region
WEST VIRGINIA WARNING AND WATCH DETAILS
--Pittsburgh Region
--Baltimore-Washington Region
--Charleston Region
VIRGINIA WARNING AND WATCH DETAILS
--Baltimore-Washington Region
--Knoxville-Morristown Region
--Blacksburg-Roanoke-Lynchburg Region
--Richmond-Norfolk Region
DISTRICT OF COLUMBIA WARNING AND WATCH DETAILS
--Baltimore-Washington Region
MARYLAND WARNING AND WATCH DETAILS
--Pittsburgh Region
--Baltimore-Washington Region
--Philadelphia Region
DELAWARE WARNING AND WATCH DETAILS
--Philadelphia Region
TENNESSEE WARNING AND WATCH DETAILS
--Memphis Region
--Nashville Region
--Huntsville Region
--Knoxville-Morristown Region
NORTH CAROLINA WARNING AND WATCH DETAILS
--Blacksburg-Roanoke-Lynchburg Region
--Greenville-Spartanburg Region
--Knoxville-Morristown Region
--Raleigh Region
--Wilmington Region
NORTHEAST AREA SEVERE WEATHER ALERTS

THE ABOVE MAP IS SEVERE ALERTS MAP SIX OF SIX
EASTERN AREA SEVERE WEATHER ALERTS
This map shows current severe weather alerts including tornado warnings and severe thunderstorm warnings for
--NEW YORK
--CONNECTICUT
--RHODE ISLAND
--MASSACHUSETTS
--VERMONT
--NEW HAMPSHIRE
--MAINE
Below are links that take you to the details for all severe weather alerts including tornado warnings and severe thunderstorm warnings for the above states. For other states including ones shown on the map but not listed above proceed to another map to find the links to the current tornado and severe thunderstorm warnings. (There are six severe weather alert maps and to minimize confusion each state is assigned to just one map by Big Tornado Country. Each state is assigned to the map that is the most appropriate from a tornado and severe storm tracking perspective.)
ALL National Weather Service Offices that cover any part of a state (even just one county) are linked to under each state. All counties are covered by at least one office; for a very small number of counties the most applicable office is in the state next door. Click on the most applicable one.
LINKS TO DETAILS FOR TORNADO WARNINGS, SEVERE THUNDERSTORM WARNINGS AND ALL OTHER SEVERE WEATHER ALERTS
NEW YORK WARNING AND WATCH DETAILS
--Buffalo Region
--Binghamton Region
--Burlington Region
--Albany Region
--New York City Region
CONNECTICUT WARNING AND WATCH DETAILS
--Albany Region
--Boston Region
--New York City Region
RHODE ISLAND WARNING AND WATCH DETAILS
--Boston Region
MASSACHUSETTS WARNING AND WATCH DETAILS
--Albany Region
--Boston Region
VERMONT WARNING AND WATCH DETAILS
--Burlington Region
--Albany Region
NEW HAMPSHIRE WARNING AND WATCH DETAILS
--Portland Region
--Boston Region
MAINE WARNING AND WATCH DETAILS
--Portland Region
--Caribou Region

CURRENT PROBABILITY OF TORNADOES WITHIN 25 MILES

PROBABILITES FOR A PARTICULAR POINT ARE FAR LESS; The probabilities shown are those for whether a tornado will occur ANYWHERE WITHIN 25 MILES of a point on the map
THE ABOVE MAP IS ALWAYS THE CURRENT AND THE LATEST AVAILABLE TORNADO PROBABILITY MAP.
Every morning at about 8 AM Eastern Daylight Time the one and only 24 hour tornado probability map is issued by the Storm Prediction Center in Norman, Oklahoma. There are four more update maps issued during the day that reflect the latest probabilities based on the latest information.
Each day the five tornado probability maps are issued according to the following schedule:
EASTERN DAYLIGHT TIME: 8 AM, 12:30 PM, 4 PM and 9 PM and 2 AM
CENTRAL DAYLIGHT TIME: 7 AM, 11:30 AM, 3 PM, 8 PM and 1 AM
MOUNTAIN DAYLIGHT TIME: 6 AM, 10:30 AM, 2 PM, 7 PM and 12 Midnight
PACIFIC DAYLIGHT TIME: 5 AM, 9:30 AM, 1 PM, 6 PM and 11 PM
The map above will always be the latest, current map. To verify this for yourself, you can check the time stamped on the map. In the lower left box look for the word "VALID". To the right of this is a one or two digit number, a forward slash, and four more digits followed by the letter Z. This combination is the start time for when the map is valid.
After a dash there is another similar combination and this of course is the end time for when the map is valid.
For both the start and the end time codes, the first number is the date (of the month). Note that neither the month nor the year is shown in any way. Only the date of whatever month it is is shown.
After the date and the forward slash you will see the time, which is given as "Z Time," which is the standard time (without regard to daylight savings time in London, England. The time numeric uses the 24 hour clock convention also known as military time. Under this format, 1500 is 3 PM, 2100 is 9 PM, 0300 or 300 is 3 AM, 1200 is 12 Noon and so on.
Using Z times and using the 24 hour clock (military time) the maps are issued according to the following schedule: 1200Z, 1630Z, 2000Z, 0100Z and 0600Z. All five maps are technically valid until 1200Z time the next day.
The corresponding US times when maps are issued were already given above.
One final thing to help you cut through all of the confusion regarding times: here is how US time zones differ from Z times:
--Eastern Daylight Time Zone is 4 hours behind Z time.
--Central Daylight Time Zone is 5 hours behind Z time.
--Mountain Daylight Time Zone is 6 hours behind Z Time.
--Pacific Daylight Time Zone is 7 hours behind Z Time.
Remember, the above map is always the current and most up to date tornado probability map.
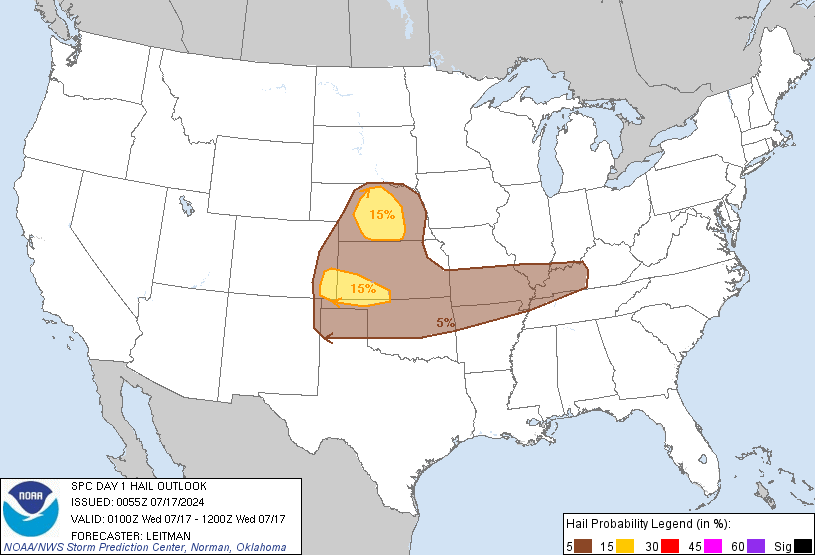
CURRENT PROBABILITY OF LARGE HAIL >3/4 INCH WITHIN 25 MILES
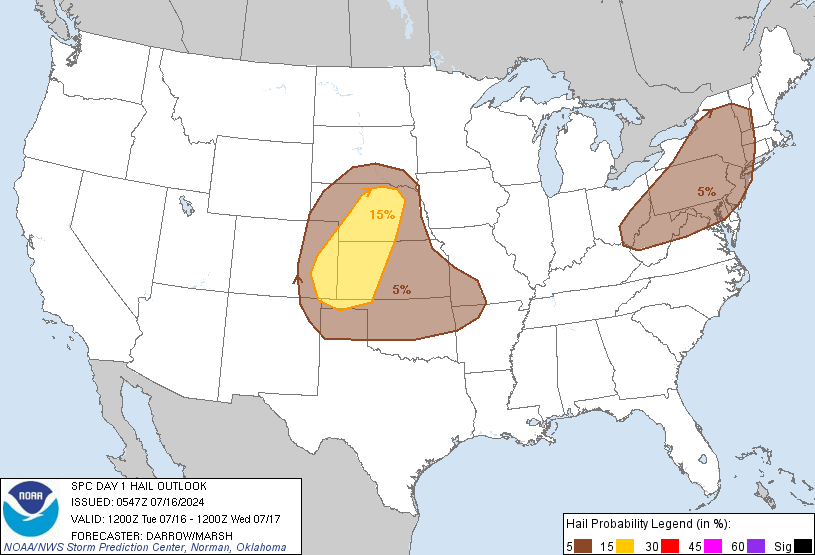
PROBABILITES FOR A PARTICULAR POINT ARE SUBSTANTIALLY LOWER; The probabilities shown are those for whether large hail > 3/4 inch will occur ANYWHERE WITHIN 25 MILES of a point on the map
THE ABOVE MAP IS ALWAYS THE CURRENT AND THE LATEST AVAILABLE LARGE HAIL PROBABILITY MAP.
Every morning at about 8 AM Eastern Daylight Time the one and only 24 hour large hail probability map is issued by the Storm Prediction Center in Norman, Oklahoma. There are four more update maps issued during the day that reflect the latest probabilities based on the latest information.
Large hail is defined as hail whose diameter is 3/4 inch or greater. Hail has to be about that size or greater before substantial property damage begins to occur.
Each day the five large hail probability maps are issued according to the following schedule:
EASTERN DAYLIGHT TIME: 8 AM, 12:30 PM, 4 PM, 9 PM and 2 AM
CENTRAL DAYLIGHT TIME: 7 AM, 11:30 AM, 3 PM, 8 PM and 1 AM
MOUNTAIN DAYLIGHT TIME: 6 AM, 10:30 AM, 2 PM, 7 PM and 12 Midnight
PACIFIC DAYLIGHT TIME: 5 AM, 9:30 AM, 1 PM, 6 PM and 11 PM
The map above will always be the latest, current map. To verify this for yourself, you can check the time stamped on the map. In the lower left box look for the word "VALID". To the right of this is a one or two digit number, a forward slash, and four more digits followed by the letter Z. This combination is the start time for when the map is valid.
After a dash there is another similar combination and this of course is the end time for when the map is valid.
For both the start and the end time codes, the first number is the date (of the month). Note that neither the month nor the year is shown in any way. Only the date of whatever month it is is shown.
After the date and the forward slash you will see the time, which is given as "Z Time," which is the standard time (without regard to daylight savings time in London, England. The time numeric uses the 24 hour clock convention also known as military time. Under this format, 1500 is 3 PM, 2100 is 9 PM, 0300 or 300 is 3 AM, 1200 is 12 Noon and so on.
Using Z times and using the 24 hour clock (military time) the maps are issued according to the following schedule: 1200Z, 1630Z and 2000Z, 0100Z and 0600Z. All four maps are technically valid until 1200Z time the next day.
The corresponding US times when maps are issued were already given above.
One final thing to help you cut through all of the confusion regarding times: here is how US time zones differ from Z times:
--Eastern Daylight Time Zone is 4 hours behind Z time.
--Central Daylight Time Zone is 5 hours behind Z time.
--Mountain Daylight Time Zone is 6 hours behind Z Time.
--Pacific Daylight Time Zone is 7 hours behind Z Time.
Remember, the above map is always the current and most up to date large hail probability map.
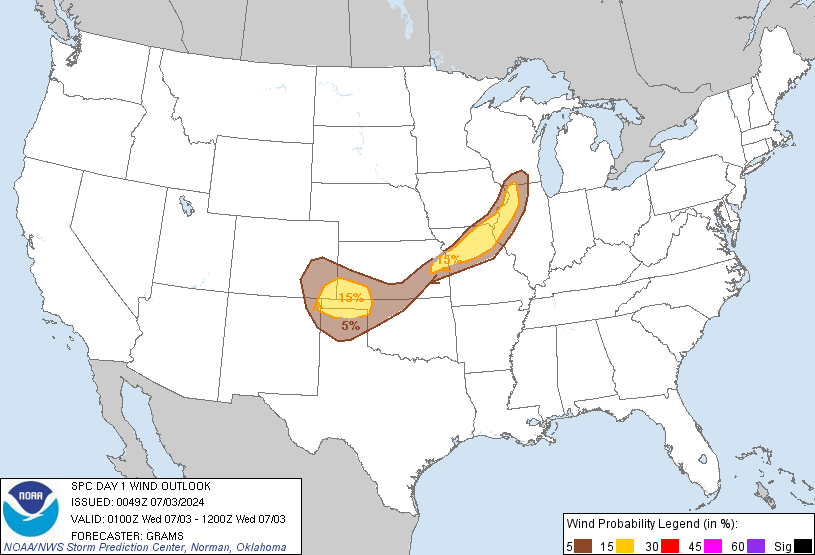
CURRENT PROBABILITY OF DAMAGING WIND GUSTS > 75 MPH WITHIN 25 MILES
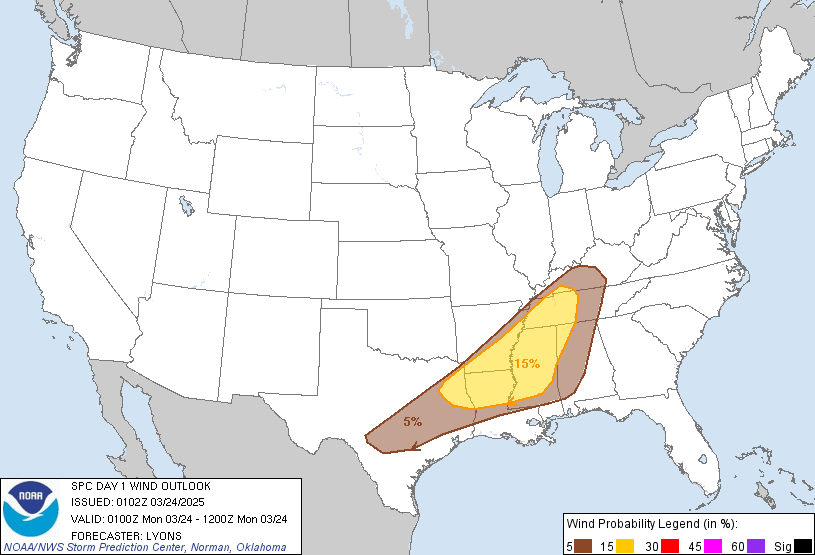
PROBABILITES FOR A PARTICULAR POINT ARE SUBSTANTIALLY LOWER; The probabilities shown are those for whether wind gusts will be > 75 mph ANYWHERE WITHIN 25 MILES of a point on the map
THE ABOVE MAP IS ALWAYS THE CURRENT AND THE LATEST AVAILABLE HIGH / DAMAGING WINDS PROBABILITY MAP.
Every morning at about 8 AM Eastern Daylight Time the one and only 24 hour high, damaging winds probability map is issued by the Storm Prediction Center in Norman, Oklahoma. There are four more update maps issued during the day that reflect the latest probabilities based on the latest information.
High winds are defined as winds producing wind gusts greater than 75 mph. Gusts have to be at about that speed or greater before most property damage begins to occur. However, in much of the US power outages can easily occur with wind gusts of just 50-60 mph or more. So when the National Weather Service thinks of damage they are thinking of something more than power outages.
Each day the five high, damaging winds probability maps are issued according to the following schedule:
EASTERN DAYLIGHT TIME: 8 AM, 12:30 PM, 4 PM, 9 PM and 2 AM
CENTRAL DAYLIGHT TIME: 7 AM, 11:30 AM, 3 PM, 8 PM and 1 AM
MOUNTAIN DAYLIGHT TIME: 6 AM, 10:30 AM, 2 PM, 7 PM and 12 Midnight
PACIFIC DAYLIGHT TIME: 5 AM, 9:30 AM, 1 PM, 6 PM and 11 PM
The map above will always be the latest, current map. To verify this for yourself, you can check the time stamped on the map. In the lower left box look for the word "VALID". To the right of this is a one or two digit number, a forward slash, and four more digits followed by the letter Z. This combination is the start time for when the map is valid.
After a dash there is another similar combination and this of course is the end time for when the map is valid.
For both the start and the end time codes, the first number is the date (of the month). Note that neither the month nor the year is shown in any way. Only the date of whatever month it is is shown.
After the date and the forward slash you will see the time, which is given as "Z Time," which is the standard time (without regard to daylight savings time in London, England. The time numeric uses the 24 hour clock convention also known as military time. Under this format, 1500 is 3 PM, 2100 is 9 PM, 0300 or 300 is 3 AM, 1200 is 12 Noon and so on.
Using Z times and using the 24 hour clock (military time) the maps are issued according to the following schedule: 1200Z, 1630Z, 2000Z, 0100Z and 0600Z. All five maps are technically valid until 1200Z time the next day.
The corresponding US times when maps are issued were already given above.
One final thing to help you cut through all of the confusion regarding times: here is how US time zones differ from Z times:
--Eastern Daylight Time Zone is 4 hours behind Z time.
--Central Daylight Time Zone is 5 hours behind Z time.
--Mountain Daylight Time Zone is 6 hours behind Z Time.
--Pacific Daylight Time Zone is 7 hours behind Z Time.
Remember, the above map is always the current and most up to date high, damaging winds probability map.
SOUTH CENTRAL AREA THUNDERSTORM FORECAST

Remember: severe thunderstorms can develop into tornadoes.
CENTRAL AREA THUNDERSTORM FORECAST

Remember: severe thunderstorms can develop into tornadoes.
NORTH CENTRAL AREA THUNDERSTORM FORECAST

SOUTHEAST AREA THUNDERSTORM FORECAST

EASTERN AREA THUNDERSTORM FORECAST

Remember: severe thunderstorms can develop into tornadoes
SEVERE WEATHER PROBABILITIES FOR TOMORROW (DAY 2) AND FOR THE DAY AFTER TOMORROW (DAY 3)
ALL OF THE ABOVE GRAPHICS ARE FOR CURRENTLY/TODAY. THE TWO MAPS BELOW SHOW THE PROBABILITIES FOR TORNADOES, BIG HAIL, AND DAMAGING HIGH WINDS WITHIN 25 MILES FOR TOMORROW AND FOR THE DAY AFTER TOMORROW; FOR EXACT TIMING DETAILS SEE THE TIMING NOTES BELOW EACH MAP
SEVERE WEATHER OUTLOOK PROBABILITIES MAP FOR TOMORROW (DAY 2)

TOMORROW'S Probability of Severe Weather Within 25 Miles of a Point. *****SEE TIMING INFORMATION ABOVE THE MAP*****
NOTES ABOUT THE TIMING OF THE DAY 2 MAP ABOVE
Note 1: The severe storms probability outlook map for tomorrow is updated once a day. When daylight savings time is in effect, the time of the update is approximately:
1:30 PM EASTERN DAYLIGHT TIME
12:30 PM CENTRAL DAYLIGHT TIME
11:30 AM MOUNTAIN DAYLIGHT TIME
10:30 AM PACIFIC DAYLIGHT TIME
In late fall and in winter, when standard time is in effect, the approximate timing of the update is:
12:30 PM EASTERN STANDARD TIME
11:30 AM CENTRAL STANDARD TIME
10:30 AM MOUNTAIN STANDARD TIME
9:30 AM PACIFIC STANDARD TIME
Note 2: During daylight savings time, the severe storms outlook probability map for the day after tomorrow covers the following 24 hours period:
EASTERN DAYLIGHT TIME: 8 AM tomorrow until 8 AM the day after tomorrow
CENTRAL DAYLIGHT TIME: 7 AM tomorrow until 7 AM the day after tomorrow
MOUNTAIN DAYLIGHT TIME: 6 AM tomorrow until 6 AM the day after tomorrow
PACIFIC DAYLIGHT TIME: 5 AM tomorrow until 5 AM the day after tomorrow
During standard time, which is in effect during late fall and in winter, the severe storms outlook probability map for tomorrow covers the following 24 hours period:
EASTERN DAYLIGHT TIME: 7 AM tomorrow until 7 AM the day after tomorrow
CENTRAL DAYLIGHT TIME: 6 AM tomorrow until 6 AM the day after tomorrow
MOUNTAIN DAYLIGHT TIME: 5 AM tomorrow until 5 AM the day after tomorrow
PACIFIC DAYLIGHT TIME: 4 AM tomorrow until 4 AM the day after tomorrow
SEVERE WEATHER OUTLOOK PROBABILITIES MAP FOR THE DAY AFTER TOMORROW (DAY 3)
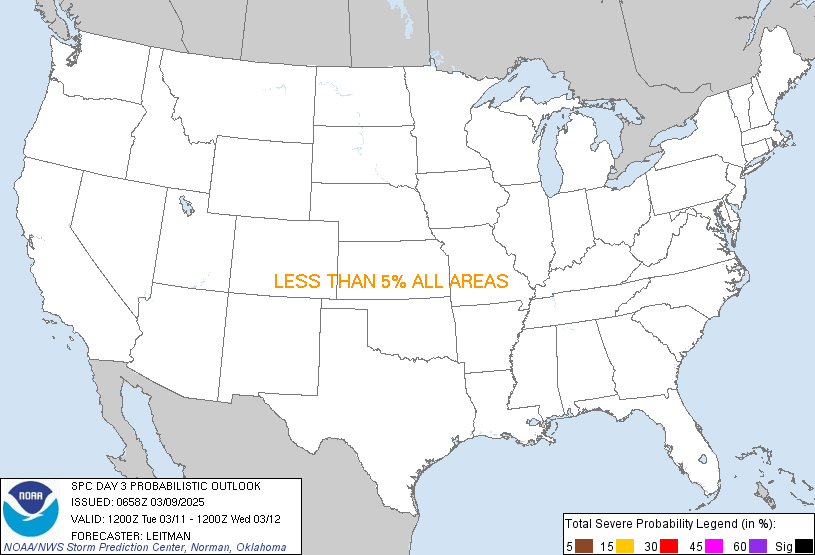
TOMORROW'S Probability of Severe Weather Within 25 Miles of a Point. *****SEE TIMING INFORMATION ABOVE THE MAP*****
NOTES ABOUT THE TIMING OF THE DAY 3 MAP ABOVE
Note 1: The severe storms probability outlook map for the day after tomorrow is updated once a day. When daylight savings time is in effect, the time of the update is approximately:
1:30 PM EASTERN DAYLIGHT TIME
12:30 PM CENTRAL DAYLIGHT TIME
11:30 AM MOUNTAIN DAYLIGHT TIME
10:30 AM PACIFIC DAYLIGHT TIME
In Winter, when standard time is in effect, the approximate timing of the update is:
12:30 PM EASTERN STANDARD TIME
11:30 AM CENTRAL STANDARD TIME
10:30 AM MOUNTAIN STANDARD TIME
9:30 AM PACIFIC STANDARD TIME
Note 2: During daylight savings time, the outlook map for the day after tomorrow covers the following 24 hours period:
EASTERN DAYLIGHT TIME: 8 AM the day after tomorrow until 8 AM the day after the day after tomorrow
CENTRAL DAYLIGHT TIME: 7 AM the day after tomorrow until 7 AM the day after the day after tomorrow
MOUNTAIN DAYLIGHT TIME: 6 AM the day after tomorrow until 6 AM the day after the day after tomorrow
PACIFIC DAYLIGHT TIME: 5 AM the day after tomorrow until 5 AM the day after the day after tomorrow
During standard time, which is in effect during late fall and in winter, the severe storms outlook map for the day after tomorrow covers the following 24 hours period:
EASTERN DAYLIGHT TIME: 7 AM the day after tomorrow until 7 AM the day after the day after tomorrow
CENTRAL DAYLIGHT TIME: 6 AM the day after tomorrow until 6 AM the day after the day after tomorrow
MOUNTAIN DAYLIGHT TIME: 5 AM the day after tomorrow until 5 AM the day after the day after tomorrow
PACIFIC DAYLIGHT TIME: 4 AM the day after tomorrow until 4 AM the day after the day after tomorrow
SOUTH CENTRAL AREA PRECIPITATION FORECAST

CENTRAL AREA PRECIPITATION FORECAST

NORTH CENTRAL AREA PRECIPITATION FORECAST

SOUTHEAST AREA PRECIPITATION FORECAST

EASTERN AREA PRECIPITATION FORECAST

CENTRAL AREA CURRENT TEMPERATURES


BEAUFORT WIND SCALE FOR WINDS MEASURED IN MPH
|
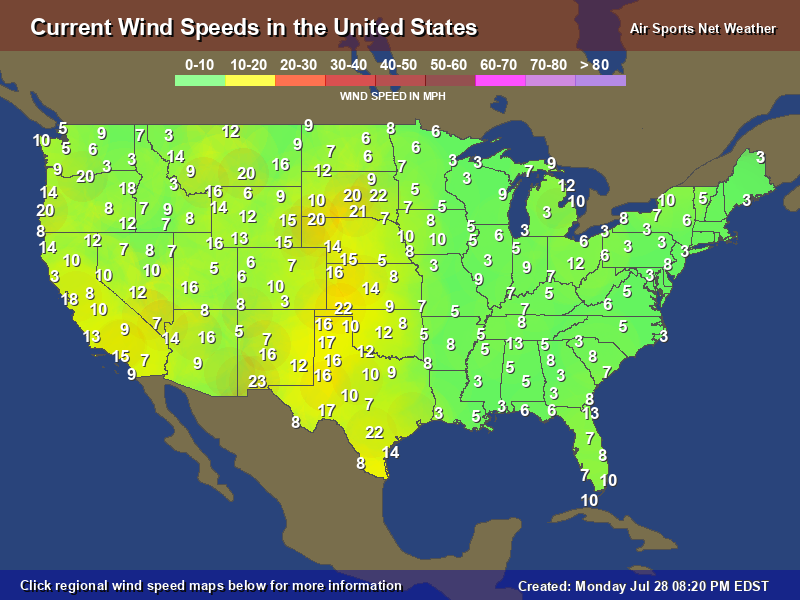
CURRENT NATIONAL WIND SPEEDS MAP 1 OF 3

THE MAP ABOVE SHOWS THE CURRENT NATIONAL WIND SPEEDS IN MPH
CURRENT NATIONAL WIND SPEEDS MAP 2 OF 3
THE MAP ABOVE SHOWS THE CURRENT NATIONAL WIND SPEEDS IN MPH
CURRENT NATIONAL WIND SPEEDS MAP 3 OF 3

THE ABOVE MAP SHOWS THE CURRENT NATIONAL WINDS SPEEDS IN KNOTS
FOR USE WITH THE CURRENT NATIONAL WIND SPEEDS MAP ABOVE - CONVERSION OF KNOTS TO MPH
|
CURRENT REGIONAL WIND SPEED MAPS FOR GREAT PLAINS, MIDWEST, SOUTH, AND EASTERN U.S.
Current Wind Speed Map Centered Around Eastern Montana
Current Wind Speed Map Centered Around Casper, Wyoming
Current Wind Speed Map Centered Around Denver, Colorado
Current Wind Speed Map Centered Around Lubbock, Texas
Current Wind Speed Map Centered Around Del Rio, Texas
Current Wind Speed Map Centered Around Houston, Texas
Current Wind Speed Map Centered Around Tyler, Texas
Current Wind Speed Map Centered Around Tulsa, Oklahoma
Current Wind Speed Map Centered Around Dodge City, Kansas
Current Wind Speed Map Centered Around Topeka, Kansas
Current Wind Speed Map Centered Around Kansas City, Missouri
Current Wind Speed Map Centered Around Grand Island, Nebraska
Current Wind Speeds Map Centered Around Pierre, South Dakota
Current Wind Speed Map Centered Around Bismarck, North Dakota
Current Wind Speed Map Centered Around Central Minnesota
Current Wind Speed Map Centered Around Des Moines, Iowa
Current Wind Speed Map Centered Around Green Bay, Wisconsin
Current Wind Speed Map Centered Around Chicago, Illinois
Current Wind Speed Map Centered Around St. Louis, Missouri
Current Wind Speed Map Centered Around Memphis, Tennessee
Current Wind Speed Map Centered Around New Orleans, Louisiana
Current Wind Speed Map Centered Around Meridian, Mississippi
Current Wind Speed Map Centered Around Cincinnati, Ohio
Current Wind Speed Map Centered Around Detroit, Michigan
Current Wind Speed Map Centered Around Toronto, Canada
Current Wind Speed Map Centered Around Rochester, New York
Current Wind Speed Map for Eastern Canada and for New England
Current Wind Speed Map Centered Around Maine
Current Wind Speed Map Centered Around Vermont
Current Wind Speed Map Centered Around Connecticut
Current Wind Speed Map Centered Around Philadelphia, Pennsylvania
Current Wind Speed Map Centered Around Pittsburgh, Pennsylvania / Morgantown, West Virginia
Current Wind Speed Map Centered Around Richmond, Virginia
Current Wind Speed Map Centered Around Knoxville, Tennessee
Current Wind Speed Map Centered Around Wilmington, North Carolina
Current Wind Speed Map Centered Around Atlanta, Georgia
Current Wind Speed Map Centered Around Central Georgia Coast
HOW TO INTERPRET THE BIG RADAR VIEWS
WARNING: THESE RADAR VIEWS OFTEN MAKE IT APPEAR THAT IT IS SNOWING OR RAINING IN MORE AREAS THAN IT ACTUALLY IS. OFTEN, IT IS SNOWING ONLY IN THE MEDIUM BLUE AND THE DARKER BLUE AREAS, AND IT IS RAINING ONLY IN THE MEDIUM GREEN, DARK GREEN, YELLOW, RED, PINK, AND PINK-PURPLE AREAS.
LIGHT BLUE (IN BELOW FREEZING TEMPERATURES), LIGHT PINK (IN TEMPERATURES NEAR FREEZING) AND LIGHT BLUE-GREEN (IN ABOVE FREEZING TEMPERATURES) MEANS THAT THERE IS VERY LIGHT PRECIPITATION, OR THAT IT IS SIMPLY VERY CLOUDY.
COLOR KEY FOR ABOVE FREEZING TEMPERATURES
PINK OR PURPLE: (Can appear to be pink or more of a pink-purple mix) Extremely severe thunderstorm and hailstorm activity at a minimum with a high probability that one or more tornadoes are present as well. TAKE COVER IMMEDIATELY IF THIS IS COMING AT YOU.
DARK RED: Very severe thunderstorm and hailstorm activity at a minimum with a possibility that one or more tornadoes are present as well. Although tornadoes are more likely in the pink or pink-purple they can very possibly be embedded in a dark red area as well. TAKE COVER IMMEDIATELY ESPECIALLY IF THERE IS A TORNADO WARNING FOR YOUR LOCATION.
MEDIUM RED: Very heavy rain at a minimum; Generally also indicates severe thunderstorm activity including a the potential for hail and even for tornado activity. The darker the red, the more severe the thunderstorm, the higher the probability that there is hail, the bigger any hail stones will be, and the higher the probability that one or more tornadoes are present as well.
LIGHT RED: Moderate to heavy rain at a minimum; generally also indicates moderate thunderstorm activity. With the light red there will not usually be any hail. and if there is hail, it will be small hail that can not damage property.
YELLOW: Moderate but not heavy rain; Sometimes also indicates light thunderstorm activity.
DARK GREEN: Moderate rain, generally no thunderstorm activity
MEDIUM GREEN: Light rain; no thunderstorm activity
LIGHT GREEN: Cloudy, perhaps a little drizzle at the most
NO COLOR: Sunny (day) or clear (night)
===========================================
COLOR KEY FOR TEMPERATURES CLOSE TO FREEZING
LIGHT PINK: Cloudy, light freezing drizzle or sleet at the most.
MEDIUM PINK: Light freezing rain or sleet
DARK PINK: Moderate freezing rain or sleet
VERY DARK PINK: Heavy freezing rain or sleet
===========================================
COLOR KEY FOR BELOW FREEZING TEMPERATURES
VERY DARK BLUE: Heavy snow
DARK BLUE: Moderate snow
MEDIUM BLUE: Light snow
LIGHT GREEN-BLUE: Cloudy, perhaps some light snow flurries. The coloring appears to be more light green-blue than light blue.
NO COLOR: Sunny (day) or clear (night)
IF ANY RADAR MAP DOES NOT OPEN ALL THE WAY, REFRESH THIS PAGE; IT SHOULD EVENTUALLY OPEN UNLESS YOUR COMPUTER SYSTEM IS DAMAGED.
TEXAS / OKLAHOMA AND VICINITY CURRENT RADAR

OKLAHOMA AND VICINITY CURRENT RADAR

KANSAS AND VICINITY CURRENT RADAR

NEBRASKA, KANSAS, AND VICINITY CURRENT RADAR

MONTANA AND VICINITY CURRENT RADAR

MINNESOTA AND VICINITY CURRENT RADAR

MICHIGAN AND VICINITY CURRENT RADAR

ILLINOIS, INDIANA, AND VICINITY CURRENT RADAR

MISSOURI AND VICINITY CURRENT RADAR

ARKANSAS AND VICINITY CURRENT RADAR

KENTUCKY, TENNESSEE, AND VICINITY CURRENT RADAR

WESTERN DEEP SOUTH CURRENT RADAR

EASTERN DEEP SOUTH CURRENT RADAR

VIRGINIA TO GEORGIA CURRENT RADAR

NORTHEASTERN AREA CURRENT RADAR

NEW ENGLAND AREA CURRENT RADAR

BIG HURRICANE AREA CURRENT RADAR


